As the semester winds down, our class has been tasked with a group capstone project. Our class met two times to discuss our capstone project and our roles in it. We all first asked ourselves what we would be interested in for a capstone project. To begin, we all wanted defined roles that we each were specifically interested in. We went around to describe what each of us wanted to get from this project and what each of us were interested in. We described what was essential to a UAS operation that would gather data and eventually deliverable data. We knew that there was going to be managers that would oversee the whole operation and be able to communicate with Dr. Hupy about how the project is going. Next there was going to be people in charge of data, flights, writing, ground control, system integration, payload integration, operation management, and flight engineering. All of these tasks were pointed out as essential and that someone was going to be in charge of it fully. They would have it as a permanent job that would need to be carried out to ensure success. Within these jobs, I chose to take flight engineer. For my task, I will be in charge of ensuring all members are properly trained to operate the platforms along with the sensors aboard. This is crucial since Indiana weather is generally unpredictable and can leave the group members without flying for extended periods of time. Ensuring that each group that flies is properly trained on each platform will reduce any chance of mishaps.
Although each group member has permanent roles, everyone has rotating roles that will ensure everyone gets to participate in the projects many jobs. These will mostly be assistant jobs, meaning that you will help someone with their permanent role. This will allow everyone to get a feel of how the other jobs are done. Our group will also be broken up into teams, or flight crews. They will be permanent and will be chosen depending on everyone's schedule for the next semester.
Monday, December 3, 2018
Tuesday, November 27, 2018
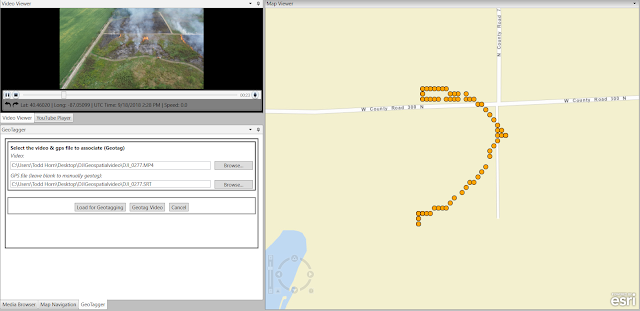
Video GeoTagger
Video GeoTagger is a free online software used to create geolocated videos. What this means is that someone can overlay a map, GPS points, and their video to give a user the ability to see where exactly the video was taken. This is particularly useful when the data is being analyzed by someone who might not have been at the sight where the video was taken. For our use, we have a drone taking a video and we were tasked with geotagging it. Below is the first video that was completed using the free geotagger software. The interface is simple and easy to work with. You simply load the video into the software then load the GPS points onto the map. You start the video and tag the video at the start, then watch the entire video then tag it at the end. Making sure that the points match up exactly with the time shown on the video.


This was done once more with another video, but exact same process.

GeoTagged videos can give the viewer much more information on the flight, which is why it is used a lot for videos that put out data. It can show where exactly the video was being taken so that someone can see where it was taken. It gives perspective to the viewer so that they can analyze data accurately. While these videos are useful in a lot of circumstances, they require ground control points or referenced locations to be most useful. Anywhere that doesn't have a noticeable feature, such as a tree, man made structure, or river would be hard to use this software. The software that we used was free, so it does not have the same accuracy that a survey grade software would have.
Thursday, November 15, 2018
Impact of altitude on high-resolution multi-spectral remote sensing for hardwood forest species delineation
The
research project chosen is looking into the impact of altitude on
high-resolution multi-spectral remote sensing for hardwood forest species
delineation. We are looking to see if there is a considerable difference in the
collection of data with a manned aircraft versus an unmanned aircraft. Altitude
is the biggest factor between the two, the unmanned system will fly lower while
the manned will fly at a greater altitude.
The purpose of an annotated bibliography is to let the reader or viewer
get an insight on what has been done that concerns our research. An annotated
bibliography consists of articles, journals, research papers, and books that
have been published (preferably peer-reviewed). A research timeline is also an
important aspect of this research. A research timeline lets groups see where
they should be in terms of the process of the research. This can be done in a
lot of ways but the most common one is a Gantt chart.
(Adão et al., 2017)
Adão, T., Hruška, J., Pádua, L., Bessa, J.,
Peres, E., Morais, R., & Sousa, J. J. (2017). Hyperspectral Imaging: A
Review on UAV-Based Sensors, Data Processing and Applications for Agriculture
and Forestry. Remote Sensing, 9(11),
1-30. doi:10.3390/rs9111110
This
article focuses on the use of hyperspectral sensors in UAS use. It addresses
the advantages of hyperspectral sensors over the use of RGB or NIR cameras for
data acquisition for agriculture and forestry. This is a great source of
information for this because it highlights drone usage and checklists for those
platforms and how to effectively collect that data. The only setback from this
article is that it doesn’t talk too in-depth about the use of this for certain
scenarios in forest and agriculture.
(Bonnet, Lisein, & Lejeune, 2017)
Bonnet,
S., Lisein, J., & Lejeune, P. (2017). Comparison of UAS photogrammetric
products for tree detection and characterization of coniferous stands. International Journal of Remote Sensing, 38(19),
5310-5337. doi:10.1080/01431161.2017.1338839
This article goes into depth about the use of UAS to detect
trees and asses forest attributes for coniferous trees. More specifically the
age of the trees and the surrounding age of the trees. While this article is
great for potentially seeing how they did it, it doesn’t give us a great idea
of what to expect for ours. The group could potentially get some ideas from
this paper on how to go about doing our research. It also does not compare it
to manned aircraft.
(Gabrlik, la Cour-Harbo, Kalvodova, Zalud, & Janata, 2018)
Gabrlik,
P., la Cour-Harbo, A., Kalvodova, P., Zalud, L., & Janata, P. (2018).
Calibration and accuracy assessment in a direct georeferencing system for UAS
photogrammetry. International Journal of
Remote Sensing, 39(15/16), 4931-4959. doi:10.1080/01431161.2018.1434331
In this
article, the studying being done is to see how well they can calibrate and
function a custom built multi-sensor for direct georeferencing. This would
enable them to get centimeter level accuracy for mapping an area. This article
shows a lot about RTK, GNS, and INS which could be used for our project to get
the data most accurately. The article has good information on these but for our
use the article does not give much about the actual data being collected.
(Getzin, Nuske, &
Wiegand, 2014)
Getzin,
S., Nuske, R. S., & Wiegand, K. (2014). Using Unmanned Aerial Vehicles
(UAV) to Quantify Spatial Gap Patterns in Forests. Remote Sensing, 6(8), 6988-7004. doi:10.3390/rs6086988
This article is looking into gap distribution of forests
being reflected by the impact of man-made tree harvesting or whether it is
naturally occurring patterns of tree death. It goes into more causes that could
be having this effect on the forest, they use UAV because of the small gaps
between the trees. Those cannot be measured accurately with manned planes. This
article is great because it shows how they utilized a drone for this reason and
how it worked. It goes into more detail than we know of, but it is still good
to get a knowledgeable base one. This article does not go into detail on how
much more accurate this data is than if it was a regular manned plane.
(Lisein, Michez, Claessens, & Lejeune, 2015)
Lisein,
J., Michez, A., Claessens, H., & Lejeune, P. (2015). Discrimination of
Deciduous Tree Species from Time Series of Unmanned Aerial System Imagery. PLoS ONE, 10(11), 1-20.
doi:10.1371/journal.pone.0141006
In this article it addresses how and when UAS should be used
to efficiently discriminate deciduous tree species. In goes into detail that
they are trying to find the best way to achieve the optimal species
discrimination and when. They state when they start and when they end, then
classify the data to discriminate tree species. This is a great article for our
group since this is very close to what we are doing. Instead of doing deciduous
tree species we are doing general tree species and if there is a difference
between manned and unmanned. Very good article for our group.
(Manfreda et al. 2018)
Manfreda, S., M.
E. McCabe, P. E. Miller, R. Lucas, V. P. Madrigal, G. Mallinis, E. Dor, D.
Helman, L. Estes, G. Ciraolo, J. Mullerova, F. Tauro, M. I. de Lima, Jlmp del
Lima, A. Maltese, F. Frances, K. Caylor, M. Kohv, M. Perks, G. Ruiz-Perez, Z.
Su, G. Vico, and B. Toth. 2018. "On the Use of Unmanned Aerial Systems for
Environmental Monitoring." Remote Sensing 10 (4). doi: 10.3390/rs10040641
This study goes into the use of UAV in environmental
monitoring. It discusses how this is done mostly by ground and satellites but
now it can be done easier and much more efficient with UAVs. It talks about how
ground and satellites have certain constraints that limit them while UAV have
little that limits them. The papers aim
is to provide an overview of the existing research of UAS in these fields.
(Pádua et al., 2018)
Pádua,
L., Hruška, J., Bessa, J., Adão, T., Martins, L. M., Gonçalves, J. A., . . .
Sousa, J. J. (2018). Multi-Temporal Analysis of Forestry and Coastal
Environments Using UASs. Remote Sensing,
10(1), 1-N.PAG. doi:10.3390/rs10010024
This
papers topic looks at the advantages and challenges related to UAVs for imagery
and data collection in forestry and costal environments. It states that two
case studies are done one focusing on chestnut tree health and the second on
the sandpit of Cabedelo in different time periods. This paper has some good
points mostly talking about how UAS and sensors have really taken off. Though,
it does not touch base with out project too much, other than techniques used
for the chesnut tree health we can only learn from how they managed to carry
out how they did it.
(Puliti, Ørka, Gobakken,
& Næsset, 2015)
Puliti, S., Ørka,
H. O., Gobakken, T., & Næsset, E. (2015). Inventory of Small Forest Areas
Using an Unmanned Aerial System. Remote
Sensing, 7(8), 9632-9654. doi:10.3390/rs70809632
This article mostly looks at the use of UAVs to inventory
small forests. This study uses 3D variables from UAV imagery with ground
reference data to create linear models for mean height, dominant height, stem
number, basal area, and stem volume. The data surrounding this topic before
this study (said in the article) was said to be inconsistent and unreliable.
This is a good article since we are looking at forests and categorizing them,
but it doesn’t talk about species. It only touches on size and actual tree
dimensions.
(Singh and Frazier 2018)
Singh, K. K., and
A. E. Frazier. 2018. "A meta-analysis and review of unmanned aircraft
system (UAS) imagery for terrestrial applications." International Journal
of Remote Sensing 39 (15-16):5078-5098. doi: 10.1080/01431161.2017.1420941.
This article performed a search using UAS related keywords
to identify peer reviewed studies. They then filtered the results to a couple
of keywords. After that, they selected a subset then deeply analyzed each
study. They found that UAS practices need better standardization of methods and
procedures for UAS data collection and practices.
(Wieser et al., 2017)
Wieser,
M., Mandlburger, G., Hollaus, M., Otepka, J., Glira, P., & Pfeifer, N.
(2017). A Case Study of UAS Borne Laser Scanning for Measurement of Tree Stem
Diameter. Remote Sensing, 9(11),
1-11. doi:10.3390/rs9111154
This study looks at diameter breast height of trees in
forestry. They use laser scanners that create high resolution point clouds
onboard UAS. The diameter breast height is estimated from a UAS point cloud.
This study is good for us for methods and techniques, but the data is not too
useful, they are using sensors to measure actual dimensions while we use
sensors to classify data.
Timeline

Timeline

Above is a Gantt chart, it is a method of tracking progress. It is used widely in many industries to keep track of the timeline that they need to follow, especially in the aviation industry. This Gantt chart was made for this study. It starts in the beginning of the school year and goes until the end of the spring semester. In the beginning, research on similar case studies to see if it has either already been done or methods which people used is looked at. It gives an outlook on how the project might go, or if it is a question that needs answered. During this time data collection is done, because they can be done independent of each other. Since the project has a manned aircraft that needs an integrated sensor, it is also put in under integration of sensors. The second half of the integration is also taking the sensor off the manned aircraft, since it could take a little longer than simply taking a couple of bolts out. After data collection begins, data analysis can also happen, overlapping with other tasks. As data analysis is going on, it runs into conclusion of the study and the paper. As the analysis takes place it will be noted.
Adão, T., Hruška, J., Pádua, L., Bessa, J.,
Peres, E., Morais, R., & Sousa, J. J. (2017). Hyperspectral Imaging: A
Review on UAV-Based Sensors, Data Processing and Applications for Agriculture
and Forestry. Remote Sensing, 9(11),
1-30. doi:10.3390/rs9111110
Bonnet, S.,
Lisein, J., & Lejeune, P. (2017). Comparison of UAS photogrammetric
products for tree detection and characterization of coniferous stands. International Journal of Remote Sensing, 38(19),
5310-5337. doi:10.1080/01431161.2017.1338839
Gabrlik, P., la
Cour-Harbo, A., Kalvodova, P., Zalud, L., & Janata, P. (2018). Calibration
and accuracy assessment in a direct georeferencing system for UAS
photogrammetry. International Journal of
Remote Sensing, 39(15/16), 4931-4959. doi:10.1080/01431161.2018.1434331
Getzin, S.,
Nuske, R. S., & Wiegand, K. (2014). Using Unmanned Aerial Vehicles (UAV) to
Quantify Spatial Gap Patterns in Forests. Remote
Sensing, 6(8), 6988-7004. doi:10.3390/rs6086988
Lisein, J.,
Michez, A., Claessens, H., & Lejeune, P. (2015). Discrimination of
Deciduous Tree Species from Time Series of Unmanned Aerial System Imagery. PLoS ONE, 10(11), 1-20.
doi:10.1371/journal.pone.0141006
Manfreda, S., M.
E. McCabe, P. E. Miller, R. Lucas, V. P. Madrigal, G. Mallinis, E. Dor, D.
Helman, L. Estes, G. Ciraolo, J. Mullerova, F. Tauro, M. I. de Lima, Jlmp del
Lima, A. Maltese, F. Frances, K. Caylor, M. Kohv, M. Perks, G. Ruiz-Perez, Z.
Su, G. Vico, and B. Toth. 2018. "On the Use of Unmanned Aerial Systems for
Environmental Monitoring." Remote Sensing 10 (4). doi: 10.3390/rs10040641
Puliti, S., Ørka,
H. O., Gobakken, T., & Næsset, E. (2015). Inventory of Small Forest Areas
Using an Unmanned Aerial System. Remote
Sensing, 7(8), 9632-9654. doi:10.3390/rs70809632
Pádua, L.,
Hruška, J., Bessa, J., Adão, T., Martins, L. M., Gonçalves, J. A., . . . Sousa,
J. J. (2018). Multi-Temporal Analysis of Forestry and Coastal Environments
Using UASs. Remote Sensing, 10(1),
1-N.PAG. doi:10.3390/rs10010024
Singh, K. K., and
A. E. Frazier. 2018. "A meta-analysis and review of unmanned aircraft
system (UAS) imagery for terrestrial applications." International Journal
of Remote Sensing 39 (15-16):5078-5098. doi: 10.1080/01431161.2017.1420941.
Wieser,
M., Mandlburger, G., Hollaus, M., Otepka, J., Glira, P., & Pfeifer, N.
(2017). A Case Study of UAS Borne Laser Scanning for Measurement of Tree Stem
Diameter. Remote Sensing, 9(11),
1-11. doi:10.3390/rs9111154
Sunday, November 11, 2018
Field Outing at Dr. Hupy's
For our lab, our class was to take video and pictures of Dr. Hupy's property. This data is going to be used for analyzing later on. The platform of use was a Yuneec H520, an orange hexacopter. While there, the ground station made a flight plan and started the flight. Before this, our class was taken around his property setting down ground control points (GCP). These are marked points on the ground that have a known geographic location. If used, GCPs must be visible in these aerial photos, so we had to place them in locations that would not be blocked by trees or other obstacles. We placed a total of 9 of these points variously around his property, remembering where they were put. For these GCPs, once done, the team is pick up the pads in the opposite direction that they placed them. For instance if you were to number them 1-9 and placed them down in sequential order, you would pick them up from 9 to 1. Once set down the drone was lifted off and started its mission. It was a success with not mishaps or incidents.
GIS Day
Main Events:
10:00 –11:00 am
Keynote: GIS for natural resources management at United Nation (STEW 206) Dr. Nicolas Picard, Food and Agriculture Organization of the United Nations
11:00am–12:20pm
Presentations (STEW 206) Spatial Humanities: What is and What Can it Be. Prof. Sorin Adam Matei, Associate Dean of Research and Graduate Education, College of Liberal Arts Race and Spatial Humanities Prof. Kim Gallon, Assistant Professor of History Forest structural diversity as a predictor of ecosystem function in North America Dr. Elizabeth LaRue, Forestry and Natural Resources My laptop takes forever, now what! Eric Adams, ITaP Research Computing
GIS day was a day to learn more about GIS and how it fits with UAS operations. Above is the main schedule that was posted (although there were more events afterwards). Although I could not make it due to illness, I was able to talk to classmates that did go to get some information about what happened. The main speaker was Dr. Picard, who was affiliated with the Food and Agriculture Organization of the United States. He talked about GIS data and how to analyze it to its full potential and also talked about mistakes other people made when trying to put out good data. The next presenter was Professor Sorin Matei, he had also talked about research projects that utilized drones. After this Professor Kim Gallon, who focused on the ethics of GIS. Professor Gallon said that people were simply looking at the numbers that we were obtaining from data capture and seeing them as just that, numbers. Similarly to comparing humans to numbers or figures on a screen or graph. Even though I could not attend, I still asked classmates for information about the talks since it did seem interesting for us in the UAS major.
In other classes I have taken, the ethical issues of treating people like a number or figure has been brought up, mainly in my remote sensing class. In my opinion it does dumb down what is actually occurring, regardless of it is serious or not. But, that does not solve much in my opinion, there isn't much people can do that will put a lasting effect on those statistics.
For our class, we have less than 10 people but our outlooks for our career vary throughout us. Although this depended on what students want to do with this major, this major can branch out in many ways so students may want to use it for GIS applications and others may want to use it for design and manufacture. Personally, I am not interested in the data side of drones but the design and manufacturing of them. This still helps if I were to be interested in making a specialized drone for a mission that required sensors that need to be outfitted professionally. Having a team of well rounded individuals that have extensive knowledge on one area of topic can help team move forward easily. If an entire team only consisted of people with knowledge in data analytics, then they will encounter difficulty in the field where they might not know much about platform usability and troubleshooting. And similarly the other way around.
All together, GIS is a very vital market for drones. Drones are going to be used for these applications more and more. The technology is evolving at an ever increasing rate and will improve how these machines can do their job, making our job even easier.
Tuesday, October 30, 2018
Field Outings
For our outing, we were to map a section of McCormick Woods. Dr. Hupy, Ryan Ferguson and Evan Hockridge were ground station, while the rest of the class were assigned as visual observers. For this mission our class was to gather data on the different colors and species of trees. The main focus was to see if it is plausible to classify trees based on their colors, during the fall season. The Yuneec platform was used to gather data at 62 meters. This is an ongoing process and data is gathered every Tuesday. Since the forest is large enough to lose visual sight of the aircraft, we split up into three groups. Two observer groups and flight control group were the assigned groups. Each group was assigned a radio, when the the group had visual contact they would report it to flight control. When contact was lost it would also be reported. The three groups would rotate around the forest after each flight to get all the required data of the forest. Communication was brief but professional to ensure that line of sight was constant.
Thursday, October 25, 2018
QGIS Introduction
GIS is an acronym used for geographic information system. GIS is not just software, it involves the entire process of presenting geographical data. From how one captures it to processing it, storing it and presenting it involves GIS. Dr. Hupy stressed that GIS is not a software, but a group of people working together to process this data to a usable, readable form of data.
Proprietary GIS software generally involves a company that owns the rights and the intellectual property behind the software. The company within has its own employees that code and work the program so that people can use it, at a cost. This software is not free and generally very expensive. Open source GIS software is free and runs on the users of the program to make it better. The programmers who use open source can embed their own code to a version that can be made specifically for them, or their use. No one owns the foundational code, so anyone who wants to use it, is free to do so. But they cannot make their own modifications to see or copyright it, since it is owned by the users. Any modifications are freely made available to any user that might be interested in using it. This is one of the ways that open source GIS software is upgraded. Users make small or big improvements then it is sent to the users to be analyzed. If the upgrade is deemed useful to the program as a whole it can then be implemented into the core software.
Open source GIS software is particularly useful for UAS industry because the user can code their own form of software tailored to their specific need. They can also work with groups of people the ensure that the software will present the best form of data to the end consumer. If a company that processes data for farmers and crops wants a map, it will be drastically different than a company needing a map for mining operations. The software will be directed towards which map they need. In proprietary software if a user needed a certain tool that didn't previously exist, they would need to make a technical ticket and describe what they need. After that, if the company that has the software decides its useful, they will then have their software engineers create that tool. The user then has to buy the tool from the company, potentially costing a lot of money.
In QGIS, we were to make a hillshade map from data previously gathered. We took the color image and created a DSM, or digital surface model. From there, we did an analysis of the DSM to create a hillshade of the map. If we wanted, we could choose from different color presets available. Each color representing a change in elevation. The previous lab required us to use a different software called ArcMap, although I could not due to me being out of the state for an aviation related event.
Creating the false color IR image of the farm was another task. First, the color image was split up into different colors, red, blue, and green. Then the layers were stacked on top and assigned a different color. At first, setting the bands to different colors was difficult. The correct sequence was needed to be set before the image would display a false color IR image. After putting in different sequences the image was eventually displaying a false color IR image of the farm.
GIS software and data is very useful for the UAS industry. Most of the industry does most of its work with high tech sensors and displaying data. Farmers, miners, construction, and government projects all rely on software processing to put out useful data to solve a problem. This software is going to be prove very useful for the capstone project of tree species delineation. Asking whether or not a UAS can perform this task better than a manned plane from varying altitudes.
Subscribe to:
Posts (Atom)